- Matplotlib - Home
- Matplotlib - Introduction
- Matplotlib - Vs Seaborn
- Matplotlib - Environment Setup
- Matplotlib - Anaconda distribution
- Matplotlib - Jupyter Notebook
- Matplotlib - Pyplot API
- Matplotlib - Simple Plot
- Matplotlib - Saving Figures
- Matplotlib - Markers
- Matplotlib - Figures
- Matplotlib - Styles
- Matplotlib - Legends
- Matplotlib - Colors
- Matplotlib - Colormaps
- Matplotlib - Colormap Normalization
- Matplotlib - Choosing Colormaps
- Matplotlib - Colorbars
- Matplotlib - Working With Text
- Matplotlib - Text properties
- Matplotlib - Subplot Titles
- Matplotlib - Images
- Matplotlib - Image Masking
- Matplotlib - Annotations
- Matplotlib - Arrows
- Matplotlib - Fonts
- Matplotlib - Font Indexing
- Matplotlib - Font Properties
- Matplotlib - Scales
- Matplotlib - LaTeX
- Matplotlib - LaTeX Text Formatting in Annotations
- Matplotlib - PostScript
- Matplotlib - Mathematical Expressions
- Matplotlib - Animations
- Matplotlib - Celluloid Library
- Matplotlib - Blitting
- Matplotlib - Toolkits
- Matplotlib - Artists
- Matplotlib - Styling with Cycler
- Matplotlib - Paths
- Matplotlib - Path Effects
- Matplotlib - Transforms
- Matplotlib - Ticks and Tick Labels
- Matplotlib - Radian Ticks
- Matplotlib - Dateticks
- Matplotlib - Tick Formatters
- Matplotlib - Tick Locators
- Matplotlib - Basic Units
- Matplotlib - Autoscaling
- Matplotlib - Reverse Axes
- Matplotlib - Logarithmic Axes
- Matplotlib - Symlog
- Matplotlib - Unit Handling
- Matplotlib - Ellipse with Units
- Matplotlib - Spines
- Matplotlib - Axis Ranges
- Matplotlib - Axis Scales
- Matplotlib - Axis Ticks
- Matplotlib - Formatting Axes
- Matplotlib - Axes Class
- Matplotlib - Twin Axes
- Matplotlib - Figure Class
- Matplotlib - Multiplots
- Matplotlib - Grids
- Matplotlib - Object-oriented Interface
- Matplotlib - PyLab module
- Matplotlib - Subplots() Function
- Matplotlib - Subplot2grid() Function
- Matplotlib - Anchored Artists
- Matplotlib - Manual Contour
- Matplotlib - Coords Report
- Matplotlib - AGG filter
- Matplotlib - Ribbon Box
- Matplotlib - Fill Spiral
- Matplotlib - Findobj Method
- Matplotlib - Hyperlinks
- Matplotlib - Image Thumbnail
- Matplotlib - Plotting with Keywords
- Matplotlib - Create Logo
- Matplotlib - Multipage PDF
- Matplotlib - Multiprocessing
- Matplotlib - Print Stdout
- Matplotlib - Compound Path
- Matplotlib - Sankey Class
- Matplotlib - MRI with EEG
- Matplotlib - Stylesheets
- Matplotlib - Background Colors
- Matplotlib - Basemap
Matplotlib Events
- Matplotlib - Event Handling
- Matplotlib - Close Event
- Matplotlib - Mouse Move
- Matplotlib - Click Events
- Matplotlib - Scroll Event
- Matplotlib - Keypress Event
- Matplotlib - Pick Event
- Matplotlib - Looking Glass
- Matplotlib - Path Editor
- Matplotlib - Poly Editor
- Matplotlib - Timers
- Matplotlib - Viewlims
- Matplotlib - Zoom Window
Matplotlib Widgets
- Matplotlib - Cursor Widget
- Matplotlib - Annotated Cursor
- Matplotlib - Button Widget
- Matplotlib - Check Buttons
- Matplotlib - Lasso Selector
- Matplotlib - Menu Widget
- Matplotlib - Mouse Cursor
- Matplotlib - Multicursor
- Matplotlib - Polygon Selector
- Matplotlib - Radio Buttons
- Matplotlib - RangeSlider
- Matplotlib - Rectangle Selector
- Matplotlib - Ellipse Selector
- Matplotlib - Slider Widget
- Matplotlib - Span Selector
- Matplotlib - Textbox
Matplotlib Plotting
- Matplotlib - Line Plots
- Matplotlib - Area Plots
- Matplotlib - Bar Graphs
- Matplotlib - Histogram
- Matplotlib - Pie Chart
- Matplotlib - Scatter Plot
- Matplotlib - Box Plot
- Matplotlib - Arrow Demo
- Matplotlib - Fancy Boxes
- Matplotlib - Zorder Demo
- Matplotlib - Hatch Demo
- Matplotlib - Mmh Donuts
- Matplotlib - Ellipse Demo
- Matplotlib - Bezier Curve
- Matplotlib - Bubble Plots
- Matplotlib - Stacked Plots
- Matplotlib - Table Charts
- Matplotlib - Polar Charts
- Matplotlib - Hexagonal bin Plots
- Matplotlib - Violin Plot
- Matplotlib - Event Plot
- Matplotlib - Heatmap
- Matplotlib - Stairs Plots
- Matplotlib - Errorbar
- Matplotlib - Hinton Diagram
- Matplotlib - Contour Plot
- Matplotlib - Wireframe Plots
- Matplotlib - Surface Plots
- Matplotlib - Triangulations
- Matplotlib - Stream plot
- Matplotlib - Ishikawa Diagram
- Matplotlib - 3D Plotting
- Matplotlib - 3D Lines
- Matplotlib - 3D Scatter Plots
- Matplotlib - 3D Contour Plot
- Matplotlib - 3D Bar Plots
- Matplotlib - 3D Wireframe Plot
- Matplotlib - 3D Surface Plot
- Matplotlib - 3D Vignettes
- Matplotlib - 3D Volumes
- Matplotlib - 3D Voxels
- Matplotlib - Time Plots and Signals
- Matplotlib - Filled Plots
- Matplotlib - Step Plots
- Matplotlib - XKCD Style
- Matplotlib - Quiver Plot
- Matplotlib - Stem Plots
- Matplotlib - Visualizing Vectors
- Matplotlib - Audio Visualization
- Matplotlib - Audio Processing
Matplotlib Useful Resources
- Matplotlib - Quick Guide
- Matplotlib - Cheatsheet
- Matplotlib - Useful Resources
- Matplotlib - Discussion
Matplotlib - Working with Text
Matplotlib offers robust text support for creating and customizing text in plots, offering flexibility and control over various text properties. Includes features like writing mathematical expressions, font customization, newline-separated text with arbitrary rotations, and Unicode support. Below is the reference image that shows how to use text in Matplotlib plots −
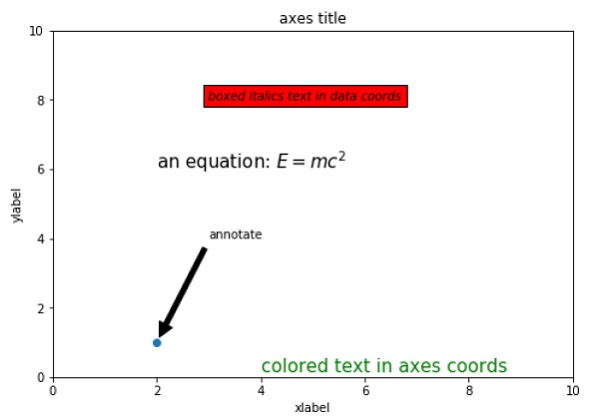
To maintain consistency between on-screen and hard copy outputs, Matplotlib embeds fonts directly into documents.
This text support extends to both implicit and explicit interfaces. The implicit API involves functions like text, annotate, xlabel, ylabel, title, figtext, and suptitle. The explicit API uses functions like text, annotate, set_xlabel, set_ylabel, set_title, text, and suptitle.
Each function returns a Text instance that can be customized with different fonts and properties.
Writing Text as Title
To write text or specify titles for the entire figure or individual subplots, you can use the suptitle function at the figure level and the set_title function at the subplot (Axes) level, respectively.
Example - Setting Subtitle and axes title
This example demonstrates the basics of creating a plot with a figure subtitle and axes title.
import matplotlib.pyplot as plt
import numpy as np

# Generate data
x_values = np.linspace(0.0, 5.0, 100)
y_values = np.cos(2 * np.pi * x_values) * np.exp(-x_values)

# Create a plot
fig, ax = plt.subplots(figsize=(7, 4))
fig.subplots_adjust(bottom=0.15, left=0.2)
ax.plot(x_values, y_values)

# Add titles to the figure and axes
fig.suptitle('Figure Suptitle', fontsize=14, fontweight='bold')
ax.set_title('Axes Title')

# Display the plot
plt.show()
Output
On executing the above code we will get the following output −
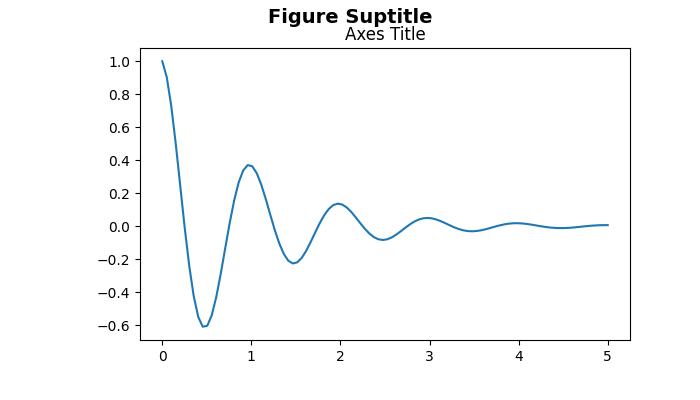
Text is added successfully to the figure and subplot...
Adding Text as Labels for Axes
For labeling or adding text to the x-axis and y-axis, you can use the functions xlabel, ylabel for the implicit interface and set_xlabel, set_ylabel for the explicit interface.
Example - X-Axis, Y-Axis labels
This example demonstrates the basics of Specifying labels for the x- and y-axis.
import matplotlib.pyplot as plt
import numpy as np

# Generate data
x_values = np.linspace(0.0, 5.0, 100)
y_values = np.cos(2 * np.pi * x_values) * np.exp(-x_values)

# Create a plot
fig, ax = plt.subplots(figsize=(7, 4))
fig.subplots_adjust(bottom=0.15, left=0.2)
ax.plot(x_values, y_values)

# Add labels to the x-axis and y-axis
ax.set_xlabel('X-Axis Label')
ax.set_ylabel('Y-Axis Label')

# Display the plot
plt.show()
print('Labels added successfully to the x-axis and y-axis...')
Output
On executing the above code we will get the following output −
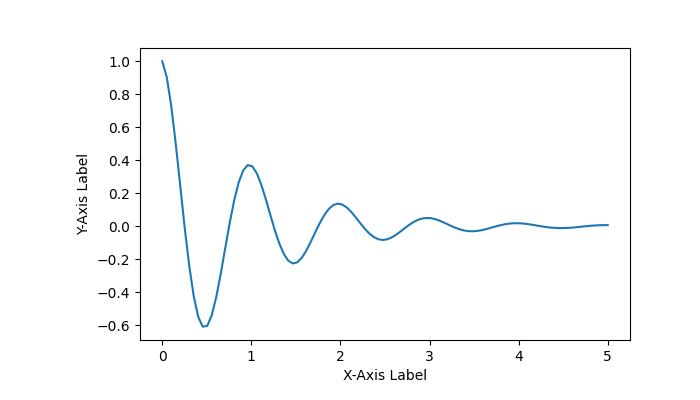
Labels added successfully to the x-axis and y-axis...
Mathematical Expressions & Unicode Text
By using the text function, it becomes possible to write mathematical expressions and Unicode text at any location within the Axes.
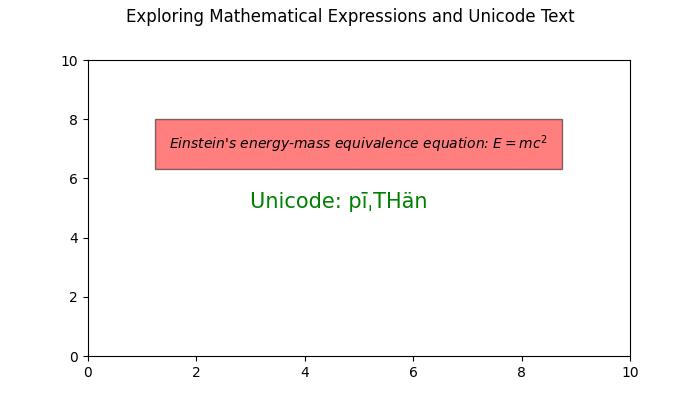
Example - Usage of Mathematical Expression
The following example demonstrates the integration of mathematical expressions and Unicode text within the plot. Here the text will add into a rectangle box by specifying the "bbox={'facecolor': 'red', 'alpha': 0.5, 'pad': 10}" values to the bbox parameter of the axes.text() method.
import matplotlib.pyplot as plt

# Create a subplot
fig, ax = plt.subplots(figsize=(7, 4))
fig.subplots_adjust(top=0.85)

# Set the figure suptitle
fig.suptitle('Exploring Mathematical Expressions and Unicode Text')

# Set both x- and y-axis limits to [0, 10] instead of the default [0, 1]
ax.axis([0, 10, 0, 10])

# Add text with Mathematical Expression
ax.text(1.5, 7, "Einstein's energy-mass equivalence equation: $E=mc^2$",
        bbox={'facecolor': 'red', 'alpha': 0.5, 'pad': 10},
        style='italic')

# Add Unicode text with specified color and font size
ax.text(3, 5, 'Unicode: pTHn', color='green', fontsize=15)

# Display the plot
plt.show()
print('Successfully created a plot with Mathematical expressions and Unicode Text.')
Output
On executing the above code we will get the following output −
Successfully created a plot with Mathematical expressions and Unicode Text.
Plotting Animated Text
Text animations can be created to dynamically display changing text content or properties over time.
Example - Animated Text
This example demonstrates how to create a simple animation in Matplotlib by updating the properties of text within a plot.
from matplotlib import animation
import matplotlib.pyplot as plt

# Adjust figure size and autolayout
plt.rcParams["figure.figsize"] = [7.00, 3.50]
plt.rcParams["figure.autolayout"] = True

# Create figure and axes
fig = plt.figure()
ax = fig.add_subplot(111)

# Initial text
text = 'You are welcome!'
txt = ax.text(.20, .5, text, fontsize=15)

# Define colors for animation
colors = ['#1f77b4', '#ff7f0e', '#2ca02c', '#d62728', '#9467bd', '#8c564b', '#e377c2',    '#7f7f7f', '#bcbd22', '#17becf']

# Define animation function
def animate(num):
    txt.set_fontsize(num * 2 + num)
    txt.set_color(colors[num % len(colors)])
    return txt,

# Create animation
anim = animation.FuncAnimation(fig, animate, frames=len(text) - 1, blit=True)

# Display animation
plt.show()
Output
On executing the above code you will get the following output −